How to pace in a 100km run?
While pacing strategies for races should be set individually, the lack of personal experience before my first 100km run suggests that it is helpful to profit from the experiences of others (rather than to make avoidable mistakes). Given that 100km road races are still probably the most “standardized” form of ultrarunning, I found substantially fewer resources than expected. Hence, in this post I want to collect what I found helpful during preparation of my 100km race and the data analysis I performed to come up with realistic expectations and a reasonable pacing strategy.
Training
Compared to marathons or ultratrails, there is relatively little easily accessible information on 100km-racing. I found a helpful overview of training plans at fellrnr.com and a rather unremarkable book , which I would not recommend to runners having some experience with structured training approaches. A synthesis of classical road running literature (such as Advanced Marathoning ) and the highly recommended Training Essentials for Ultrarunning seems to be more relevant. Overall, it seems to be reasonable to follow a basic marathon training approach, but with less focus on speed work and tempo runs in favor of long runs (up to 60km) and more frequent depletion of glycogen stores.
Pacing
In order to get insight into pace distributions, I looked at data from the 100km world championships in Winschoten (2011 and 2015) as well as Los Alcazares in 2016. Both courses consisted of 10 laps that seem to be reasonably flat, reducing confounders for the pace evolution. While there is a paper on pacing strategies for 100km races, the authors solely look at data from Biel, which makes the split times hardly comparable due to the differences in terrain along the course. Additionally, running through the night in Biel (start at 22:00 and finish during daylight) and the corresponding confounding influence of the circadian rhythm suggests that it is may be better to discard Biel.
The split times for Winschoten are available from the official website. The Los Alcazares times, however, are crawled from the Strava activities of runners that had flybys activated. To increase relevance, I kept only the data of runners that had finish times below 7:30 or started out with a pace faster than a 4:12 min/km (i.e., a potential 7:00 hour finish time).
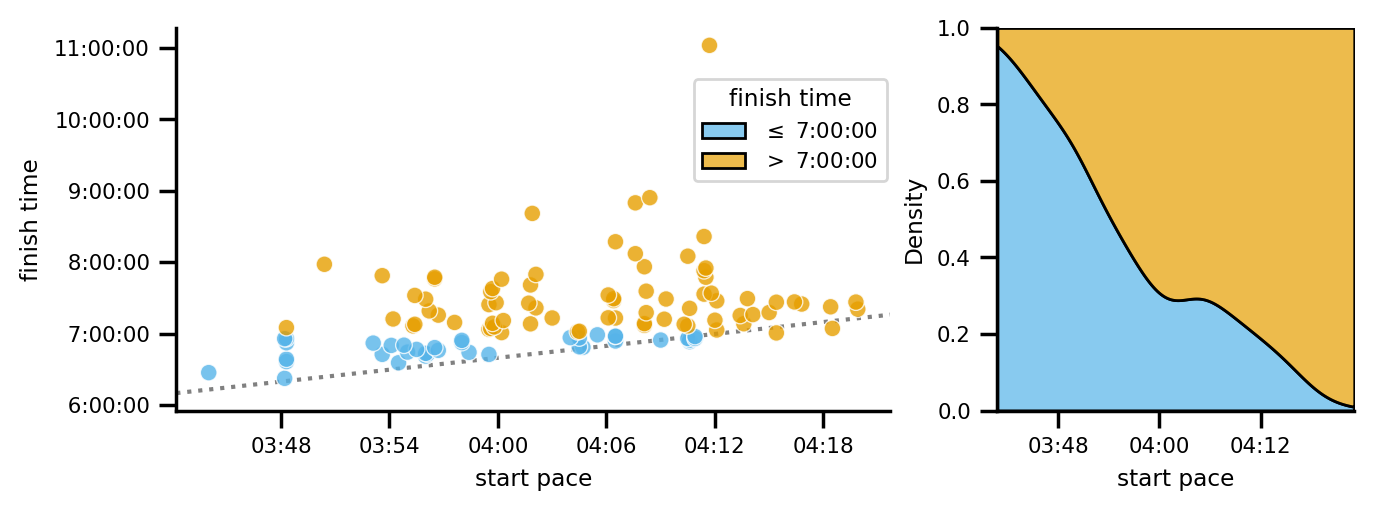
Seeing the substantial slowdown (i.e., points above the diagonal in the plot above), it is helpful to look at the 10km-splits of individual runners:
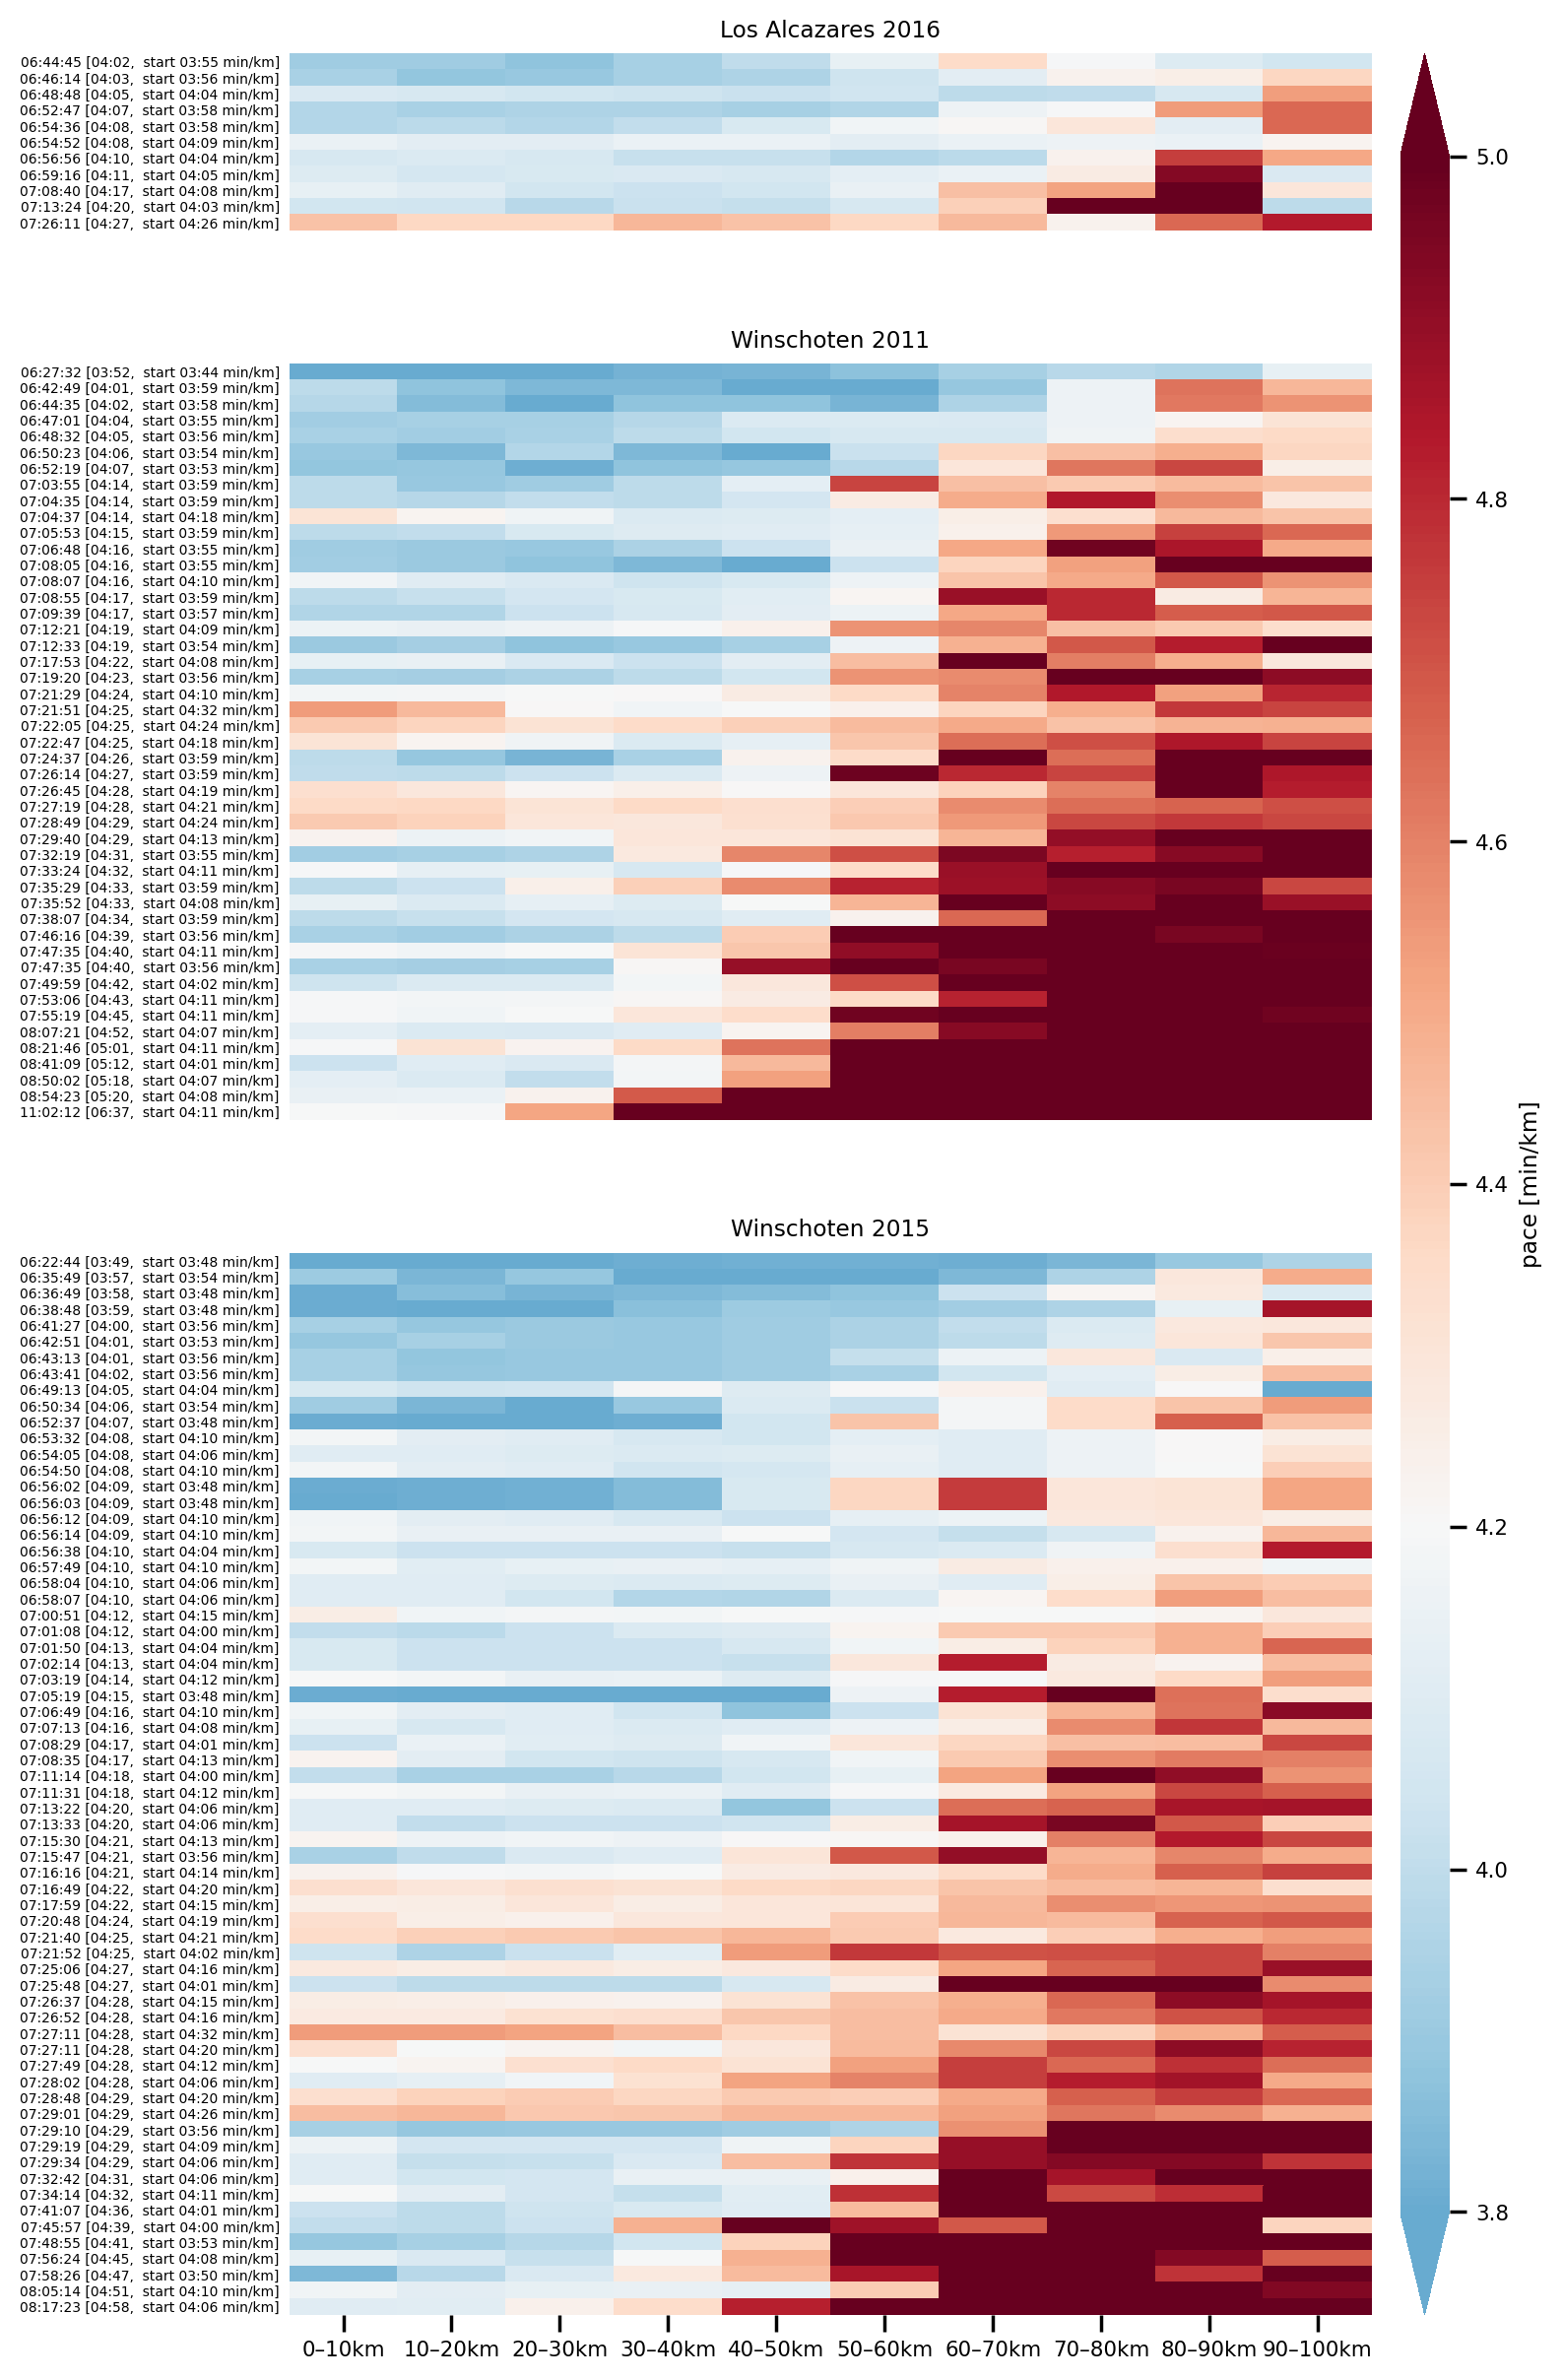
Looking at the degradation of individual running splits, most runners slowed down after 60 or 70km. The slowdown in Winschoten in 2011 seems to be much higher, potentially indicating whole groups of runners started out too fast.
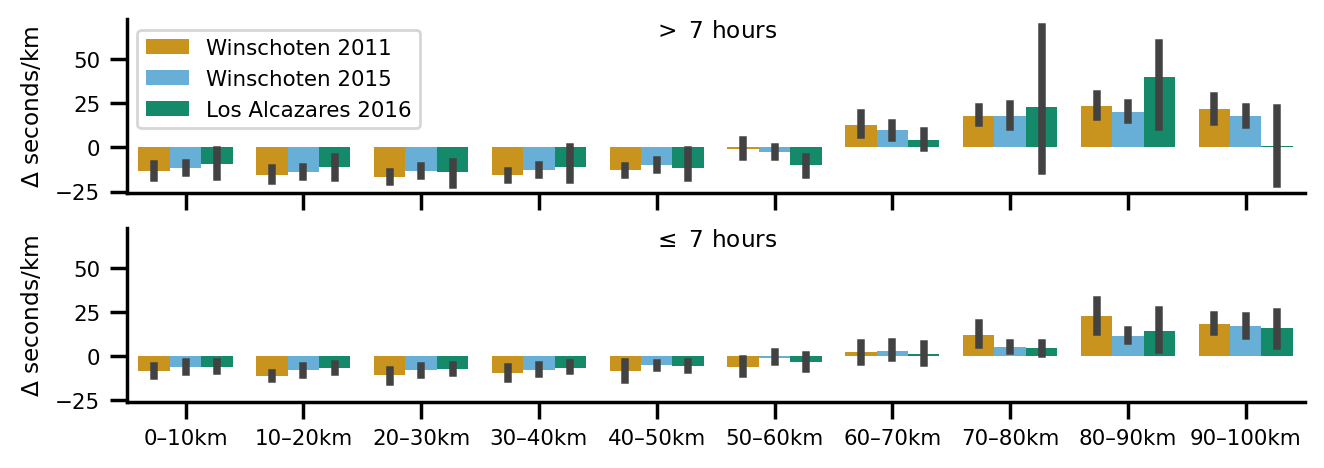
Aggregating runners by finish times below and above seven hours suggests that the timing of the slowdown may play a larger role than the change in pace. However, as the split times are the aggregate result of many aspects—from starting out at an unrealistic pace, muscular or nutritional problem to changes in weather etc.—it is, however, likely not helpful to interpret too much based on this data alone. However, it seems clear that barely any runners managed to keep a steady pace or speed up in later parts.
In order to come up with a point estimate of realistic paces, it seems reasonable to take the median of the lap-wise difference to each runner’s mean pace, grouped by finishing below and above the target of seven hours:
| total | faster than 7:00 | 0–10km | 10–20km | 20–30km | 30–40km | 40–50km | 50–60km | 60–70km | 70–80km | 80–90km | 90–100km |
|---|---|---|---|---|---|---|---|---|---|---|---|
| False | -00:12 | -00:13 | -00:13 | -00:13 | -00:10 | -00:05 | 00:06 | 00:14 | 00:21 | 00:17 | |
| True | -00:06 | -00:08 | -00:08 | -00:07 | -00:05 | -00:03 | -00:00 | 00:05 | 00:10 | 00:16 | |
| 6:55:00 | False | 03:57 | 03:56 | 03:56 | 03:56 | 03:59 | 04:04 | 04:15 | 04:23 | 04:30 | 04:26 |
| 6:55:00 | True | 04:03 | 04:01 | 04:01 | 04:02 | 04:04 | 04:06 | 04:09 | 04:14 | 04:19 | 04:25 |
| 6:58:00 | False | 03:59 | 03:58 | 03:58 | 03:58 | 04:00 | 04:06 | 04:17 | 04:25 | 04:32 | 04:28 |
| 6:58:00 | True | 04:05 | 04:03 | 04:03 | 04:03 | 04:05 | 04:08 | 04:11 | 04:16 | 04:20 | 04:27 |
| 7:00:00 | False | 04:00 | 03:59 | 03:59 | 03:59 | 04:02 | 04:07 | 04:18 | 04:26 | 04:33 | 04:29 |
| 7:00:00 | True | 04:06 | 04:04 | 04:04 | 04:05 | 04:07 | 04:09 | 04:12 | 04:17 | 04:22 | 04:28 |
| 7:15:00 | False | 04:09 | 04:08 | 04:08 | 04:08 | 04:11 | 04:16 | 04:27 | 04:35 | 04:42 | 04:38 |
| 7:15:00 | True | 04:15 | 04:13 | 04:13 | 04:14 | 04:16 | 04:18 | 04:21 | 04:26 | 04:31 | 04:37 |
Hence, a starting pace between 4:01 and 4:03 seems to be reasonable to achieve a finish time below 7:00:00—and at least for me, it was .
Henrich Kolkhorst
brains, robots, running
My research interests include brain–machine interfaces and human–robot interaction. Aside, I’m a competitive runner and triathlete.